This month, my posts are focusing on my productivity tools.
I have used the Pomodoro Technique on-and-off for ten years. I find it really helps me keep track of what I'm doing, especially since I have ADHD. Over time, patterns have emerged around how I do the Pomodoro Technique. This series showcases some of those things.
Reports are mentioned in the book, but it is left open-ended what reports to use.
I often use two spreadsheets.
One is the entry by day, and one is the entry by tasks.
Daily Entry
In the "Daily Entry" spreadsheet, I have the following columns:
- Date
- Day
- Whether or not the day was a WFH day
- Number of pomodoros planned
- Number completed
- Internal interruptions total for the day
- External interruptions total for the day
- Withdrawl failures total for the day (see previous post)
- Number of tasks done
- Number of commitments done
This spreadsheet allows me to show improvement of consistency over time. For example, I know now that I tend to get about 5-7 pomodoros done in a day, and I tend to plan about 7-9 pomdoros of work. It helps me track how hectic my day is over time (interruptions). It also helps me track how efficient I am by looking at the number of tasks done versus the number of tasks "that matter" are done (number of commitments done). Actually, I am not very efficient. Looking at my previous post, I have 3 pomodoros scheduled (half my productive day) before I get anything else done. Often the number of commitments done in a day is 0 or 1. 2 is a good day. Also helps me track whatever is interesting at the time over time, like whether or not I'm more productive at home than at work.
Entry by Task
In the "Task Entry" spreadsheet, I have the following columns:
- Date
- Task description
- Number of pomodoros planned
- Number of pomodoros completed
- Number of internal interruptions for the task
- Number of external interruptions for the task
- Number of withdrawl failures for the task
- Whether or not the task was a spike (open-ended)
- Whether or not the task was completed
- Type of task, whether communication, organization, commitment, or discretionary
This spreadsheet helps me understand how much better I am at doing tasks:
- How good I am at estimating my work
- How good I am at fulfilling commmitments
- What gets me hyper-focused and unable to stop working on it (withdrawl failures)
Graphs
These are graphs of my performance over time in the Daily Entry sheet:
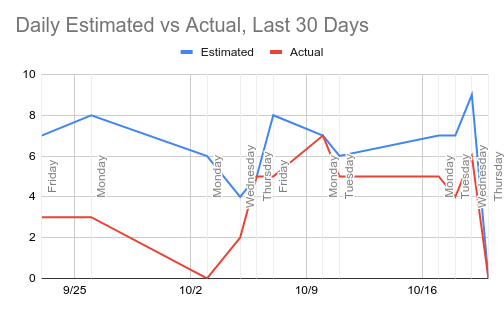
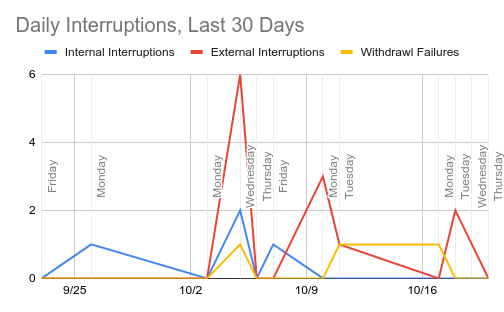
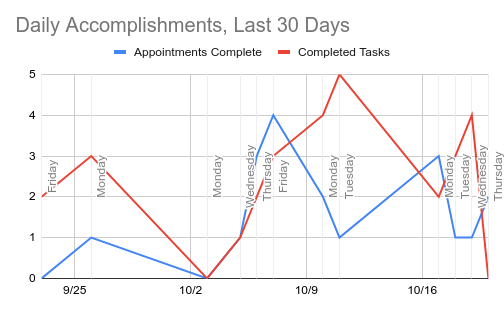
It's all over the place, but we see trends. No work on the weekends. Fewer interruptions on Wednesdays (my WFH day). Fewer interruptions over time as I get better.
These graphs come from my tasks sheet:
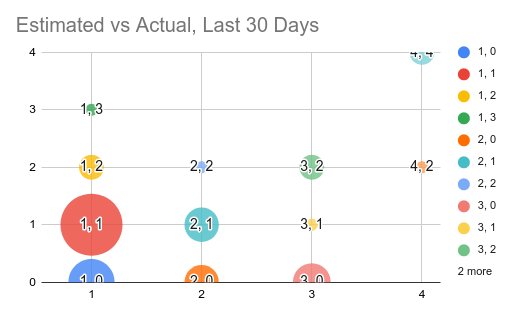
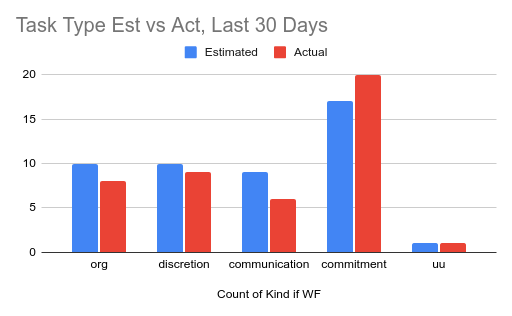
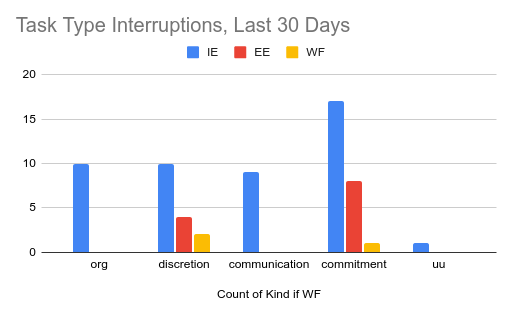
We see a very interesting trend on how I might start tweaking how I estimate.
It's all about what needs improving
Charts are a living document, and change based on what I need to learn about myself. Perhaps why the Pomodoro Technique book leaves things so open-ended.