Introduction
I decided to write this usage report from a thread on the Telegram Common Lisp channel:

Alive is a VS Code plugin that aims to make it easy to develop Common Lisp from that editor.
It is a well-known way to develop Common Lisp, though perhaps not very common.
I haven't ever used it before, so when I saw that question, I thought, why not.
So I tried using the plugin and wrote down how I felt about the plug-in as I coded something up.
That experience report is below.
Experience Log
I'm just going to open up VS Code, install the plugin, solve a coding problem, and write down my thoughts as I do so.
At the end I'll draw conclusions for posterity.
Here we go!
Off the bat we have this scary pop-up when using Alive:

So that's awkward.
I just clicked "Agree" or whatever.
After that, it complained in the output that cl-json wasn't installed, so the
Alive LSP couldn't start up. Also sad. I had to go to a terminal, fire up SBCL,
and run (ql:quickload "cl-json"). After I did that and re-opened VS Code, it
worked. The LSP came up. That could just be because of my janky Windows set-up
though. Maybe it would work fine for a newbie if they came in fresh.
This is actually pretty sweet. It lands adds this cool lisp pane on the side, with things like "REPL History", "Inspector", "Packages", and "ASDF Systems". Nice.
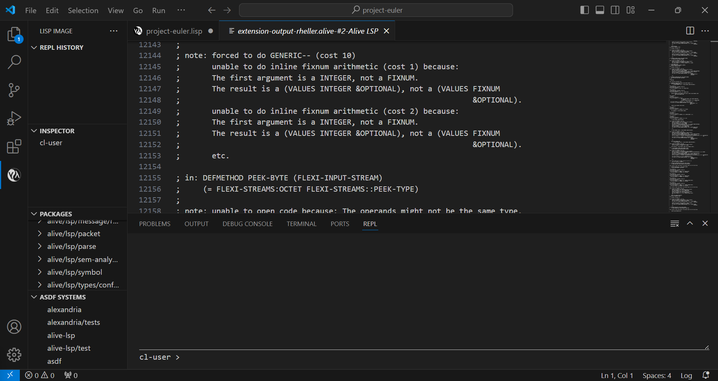
OK.
Now what.
Oh yeah, the Project Euler problem I'm working on. This is what I'm going to code up in this blog post.
(PE doesn't like you spoiling the problems past problem 100, but we're on problem 38, so we're cool.)
Let's open that up and start working on it. Here are some of my thoughts as I'm working. Stream of consciousness, more or less.
Stuff "just works". Compiler warnings are built in like you would expect.

I can right-click and select "Format Selection", works great.
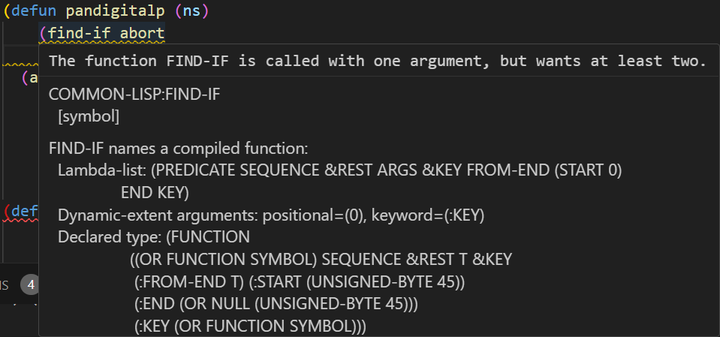
Hovering shows docs!
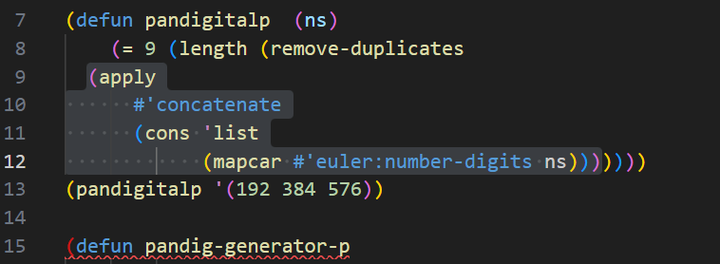
Shift+Alt+Up Arrow selects an S-Expression:
Caveat, Shift+Alt+Down Arrow copies the line, which was unexpected and definitly not anything to do with the REPL.
It wasn't long 'till I was zoned out working.
If you don't have all the parentheses match up, though, indentation breaks, so don't delete the close parens.
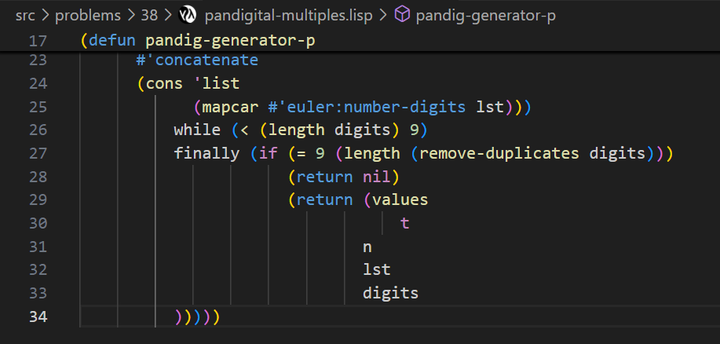
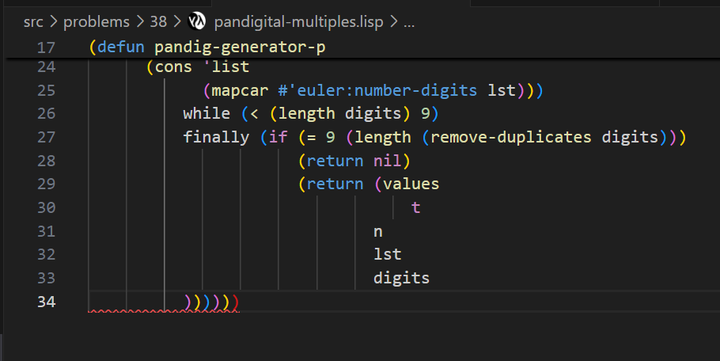
VS Code shows me the top function line no matter where I am in the function:
Too many parens yields an error, as expected:
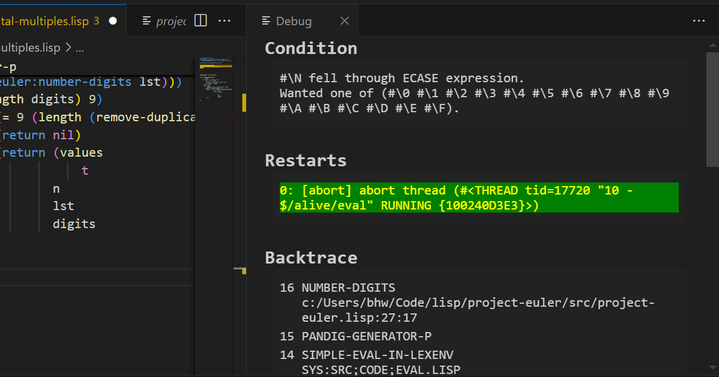
Whoops! Ran something that broke. A nice debugger window pops up to the side to rescue the error.
I can select restarts:
If I select the backtrace, it takes me right to the line of code that broke!
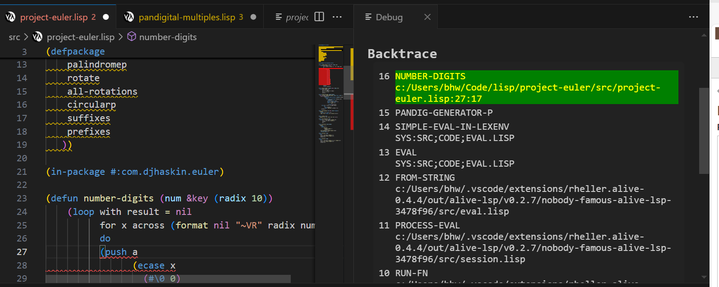
Hmmm. Can't seem to inspect variables for a particular stack frame. That's a bummer.
Oh well. Can't have them all. Still, this is a big, big feature that I can get just by using the command line REPL, no IDE required. I'd like to see the variables in a frame.
It seems I can inspect symbols' values, but not during a debug session.
Can't find a way to move from an opening paren to its mate automatically. Maybe that's just something I'm used to from Vim that VS code doesn't have. Odd though, since it highlights its mate just fine:

As I'm writing this report, I'm finishing the problem.
Solved the problem.

Conclusion
The usage experience was very ergonomic, much more ergonomic than I'm used to with my personal CL set-up. Still, the inability to inspect stack frame variables would bother me, personally.
All in all, a great rig. I can see this being really useful, particularly for beginners. It's nice to see a way to develop Common Lisp that doesn't involve learning the heavy machinery of emacs (or Vim!) off the bat. The learning curve is steep enough without worrying about learning a whole editor first, and the tooling is good enough to use into intermediate and even advanced skill.